
The Dashboard tab contains summary information about the units from the Work Station. Here you can quickly assess the connection and motion state of the units, see the latest online notifications as well as the geofences where the units are located, and so on. The information is updated as new messages are received from the units.
To open the Dashboard tab, click on the same name item in the top panel. The tab is displayed if the Dashboard item is selected in the main menu customiser.
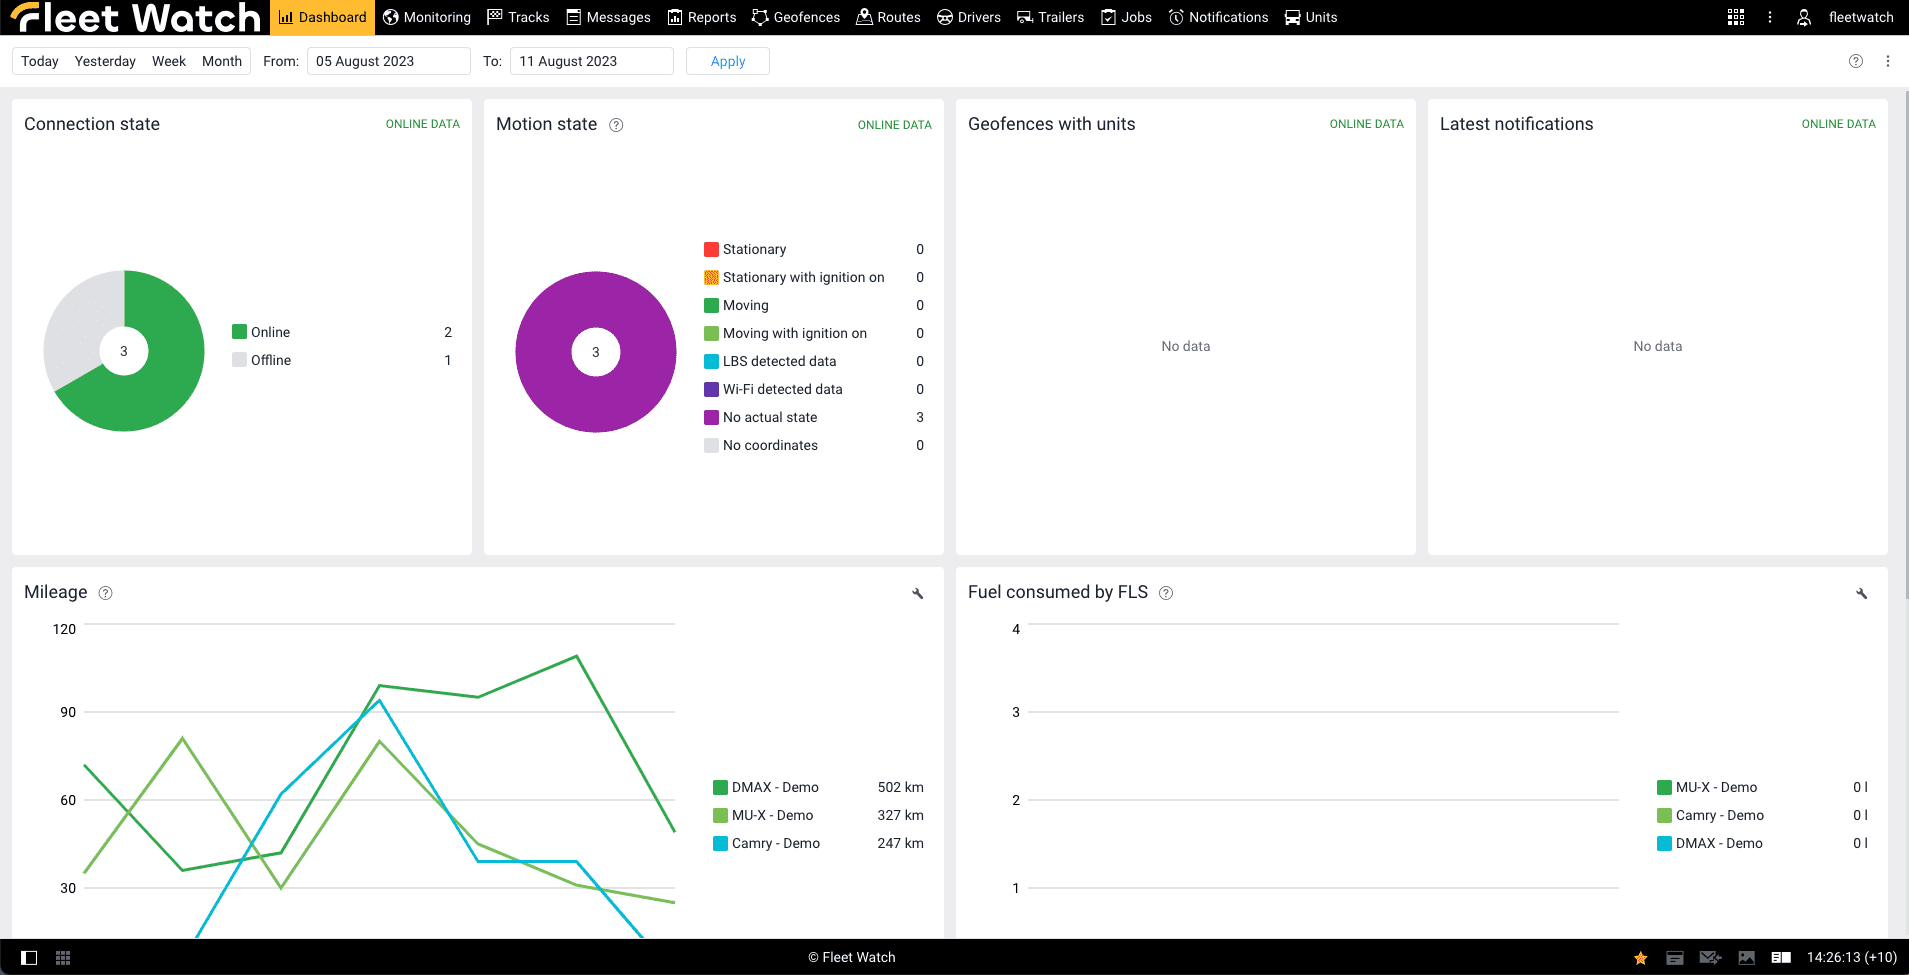
Seven information blocks are available on the tab. In the Dashboard settings (![]() ), you can select the blocks which you would like to be displayed. You can also change their order by clicking on the heading of the block and dragging it to the required place.
), you can select the blocks which you would like to be displayed. You can also change their order by clicking on the heading of the block and dragging it to the required place.
The Connection state, Motion state, Geofences with units, Latest notifications blocks show real-time data. The Mileage, Fuel consumed by FLS, Speedings blocks display information for the last seven days by default. To see data for another time period, complete the Interval fields with its beginning and end manually or using the calendar, and click Show. To see data for a certain day, specify it as the interval beginning and end. Besides, you can select one of the preset intervals: today, yesterday, week, month. Every time you sign in, the default interval is applied.
Connection state
This section features a pie chart that provides insights into the connection state of units—whether they are online or offline. Adjacent to the chart, a legend delineates the meaning behind each colour and quantifies the number of units associated with each category. Hovering over a specific segment of the chart reveals the percentage of units aligned with that particular category.
To gain access to a comprehensive list of units within a specific category, simply click on the corresponding entry within the legend. This interaction allows you to explore the units belonging to each category in detail.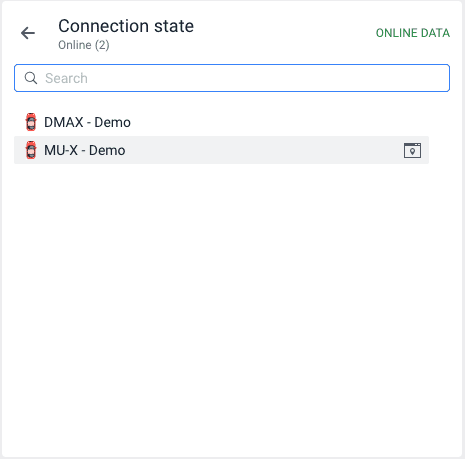
To quickly find units by name, use the dynamic search above the list. Click on the line with the unit to open its minimap.
Motion state
This segment encompasses a pie chart that conveys data regarding the motion state of units. The chart’s legend provides insight into the category represented by each colour, along with the corresponding count of units associated with it. Hovering over a specific sector of the chart reveals the percentage of units belonging to that particular category.
For an in-depth view of the units within a specific category, simply click on the corresponding entry within the legend. A dynamic search feature situated above the list assists in quickly locating units by their names. By clicking on a unit’s entry in the list, you can access its accompanying minimap for further exploration.
Geofences with units
This section becomes visible when the “Presence in geofences” option is enabled within the user settings. It presents a roster of geofences wherein units are currently situated. Each geofence entry includes the type (depicted graphically), the geofence’s name, and the count of units located within it.
To view a comprehensive list of all units residing within a specific geofence, simply click on the corresponding geofence name. Above this list, a dynamic search feature is provided to swiftly locate units by their names. Additionally, clicking on a unit’s entry within the list will open its associated minimap for further details.
Latest notifications
Within this section, you’ll find a compilation of the most recent online notifications, accompanied by their corresponding date and time of receipt. To access the details of a specific notification, simply click on its name.
Mileage
This section presents a line chart that captures unit mileage data over a specified interval (defaulted at seven days). If the timeframe extends beyond 14 days, the chart data is aggregated. In instances where the interval encompasses only one day, dots are employed in lieu of continuous lines.
The chart’s legend showcases the unit’s mileage and its corresponding colour code. Hovering over a unit within the legend preserves its line colour on the chart, while others transition to a grey shade. Furthermore, when hovering over a specific day’s segment on the chart, a tooltip displays unit mileage data for that particular day.
Upon initial display, the chart exhibits data for the first ten units from the work list. To modify this selection, simply click on the ![]() and choose the desired units (limited to ten). The dynamic search feature facilitates swift unit identification. Subsequently, clicking the
and choose the desired units (limited to ten). The dynamic search feature facilitates swift unit identification. Subsequently, clicking the ![]() navigates to the chart. Rest assured, your chosen units remain selected upon your next login.
navigates to the chart. Rest assured, your chosen units remain selected upon your next login.
Fuel consumed by FLS
The line chart within this section illustrates the fuel consumption recorded by units through the fuel level sensor (FLS) for the designated timeframe (defaulted to seven days). When the timeframe surpasses 14 days, the chart data is consolidated. In cases where the interval spans only a single day, dots are employed instead of continuous lines for representation.
The chart legend depicts the fuel consumption volume attributed to each unit, represented by its corresponding colour. In cases where a unit is equipped with multiple Fuel Level Sensors (FLS), the cumulative value of their readings is presented. When hovering over a unit within the legend, its associated line on the chart maintains its colour while the remaining lines fade to grey. For insights into the fuel consumed by the units on specific days, simply point to the relevant segment of the chart representing that particular day.
By default, the chart shows data on the first 10 units from the work list. To change them, click on the icon  and select the required ones. (no more than 10). To quickly find units, use the dynamic search. Then click on the icon
 ![]() to go to the chart. When you sign in the next time, the same units remain selected.
to go to the chart. When you sign in the next time, the same units remain selected.
Speedings
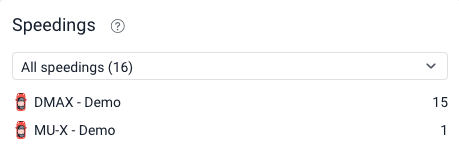
This block contains the list of units for which speed limit violations have been detected for the specified interval (seven days by default). Opposite the name of the unit, by default, the number of all its violations is shown. To filter them, select the necessary range of values in the drop-down list in the upper part of the block. For example, you can display the number of violations where the speed limit was exceeded by 10 to 20 km/h.
To see the violations of the unit in this block, the Road limits method of speeding detection should be selected on the Advanced tab of the unit properties.
Top units by fuel consumption
The block displays units with the maximum fuel consumption detected by FLS for the specified interval (seven days by default). The volume of fuel consumed by the unit is shown opposite its name and is additionally displayed in the horizontal chart on the right.
Top units by mileage
The block displays units with the maximum mileage for the specified interval (seven days by default). The mileage of the unit is shown opposite its name and is additionally displayed in the horizontal chart on the right.
